
DCBS web reports
The following topics describe how to use the interface for DCBS Actuate web reports.
- Using reports from a web
- Viewing reports
- The Toolbar
- Printing
- Using search with reports
- Saving search results
- Using the Table of Contents (ToC)
- Downloading data from within a report (once displayed on screen)
- If you get an error message that starts "cannot fine the specified file or folder..."
- If you get an error accessing files on the O: drive
Not all reports in the Report Catalog are Actuate reports.
You can view DCBS report documents over the Web without the need to install any desktop software aside from a standard web that supports Javascript and Dynamic HTML (DHTML).
Viewing reports
When you view a report, you see a layout like the following sample. It has 3 different zones.
1.
The top area is used for navigation outside of the report.2. The horizontal dark teal bar is for navigation inside the report. It is called the toolbar. Use the toolbar to navigate through the report, search the report, and save data from the report.
3. The large area displays the report itself.

The toolbar controls perform the following functions:
- ToC hides and shows
the report's table of contents. Using the table of contents, you
can go to a specific section of the report. More
on the TOC.
- The next 4 links move you between pages of the report
- Enter a page number and press the Goto button to go directly to a page.
- To change the report page size, select a percentage
size from the list. The setting remains until you change the
percentage. DCBS reports are usually displayed at a size of
75%.
- Search allows you to
search for specific data in a report and to select parts of a
report for downloading. More
on search.
- Download lets you save the
report in different formats (such as a RTF, an Excel file, a PowerPoint file, or a PDF).
- Print - In order to print a
report or selected pages from a report, you must first click this
button to create a PDF document. Once you have the PDF document on
your PC, you can print the pages you want. More
on Printing.
- Help displays this document.
Use Print to either print,
or save all or part of your report in Adobe PDF format on your local
machine.
After you select
Print , you see the following page.
1. Select a page range. For the Pages option (bottom), enter the pages to save. You can enter a series of pages separated by commas, for example 1,3,7, or a range of pages separated by a hyphen, for example, 5-10. Pages generate in ascending order.
2. Then click on either OK to begin printing
the page or
Cancel to close the print dialog box and go to
Acrobat Reader
NOTES:
A. Tip: After you click either button, Microsoft Internet Explorer might not display PDF report pages correctly in the . If you are using Adobe Acrobat Reader 4.0, upgrading to version 4.05 might solve this problem. Otherwise, press F5 to refresh the viewing window, or save the PDF report to a local disk before viewing
B. Depending on the memory available on your system, the Adobe Acrobat reader can have problems opening or viewing large PDF files. When saving a large number of pages to PDF, your web can display a time out message before saving is complete. You can save the pages using multiple save operations.
C. When viewing, saving, or printing the PDF file, the PDF can appear different from the displayed report. The differences fall into the following categories:
- Intentional differences are part of the report design implementation. Report designers can include or exclude some elements of the report from the PDF. For example, the report's table of contents, Scripting Controls, and images do not necessarily appear in the PDF.
- Unintentional differences are those differences over which the
report designer does not have full control, for example:
- Linked or embedded objects such as images or spreadsheets in reports can cometimes cause problems. If a link to an object fails to produce the object in the PDF, an X appears in place of the object.
- settings can affect wordwrap characteristics of the display.
Contact the DCBS report team if you experience problems that match the unintentional differences included in the preceding list.
To save this report, you can choose from several different options.
After clicking the download button, the following screen will appear:
From here you can choose to save or view your report as one of the following file types:
- PDF, with the ability to save the file as a low or high quality pdf.
- Excel Data, which can then be manipulated.
- Excel Display, which displays the report using Excel in much the same way it appears as a report.
- Power Point, to save the report as an editable presentation.
- RTF and Fully Editable RTF both save the report as a rich text format document that can be changed by your word processing program.
All of these options allow you to save the current page of the report you are on, the whole report, or a range of pages.
When you choose the Search button, the Smart Search window appears. The word Searchable appears if you move your cursor over a searchable field. Before the report page finishes loading, links are active in the report window.
From the right pane, select a report field you want to search on. You can select multiple fields to search on. Click on an item to add it to the search window.
Wait until the report page finishes downloading, then enter the search value (query value) for each field.
The following illustration shows the Smart Search window after choosing the Employer Name field.
We've chosen to search for a farm camp owned by the Bodunov family, but don't know exactly how the name is stored. If we add wild cards (asterisks - *) before and after the name, we will increase the chance of getting results. For more information about the query syntax, see Using Smartsearch.
In the Smart Search window, you can do the
following:
- To remove a field from the search, choose the X button.
- To remove the search fields from the query window, choose New Search.
- To display the field in the results field, choose the Display option. If you enable the Display option, the data from the field appears in the Search Results page.
- Note the use of a wildcard ( * ) in the search value. This search will show all Employers that contain the word "Bodunov."
The following illustration shows a completed search with 2 items found.
The items found are linked to the report page. When you select an item listed in the Smart Search Results page, the report in the right window changes to the report page with the matching item.
Searching large reports can cause a timeout message to appear before the search finishes. Contact the report server administrator if this occurs.
|
It is a hyperlink-based device for navigating through the report. If a subsection has a triangle next to it, hover the cursor over the triangle. If it changes to a downward pointing arrow, there are sub-topics available. Not every report has a Table of Contents. |
 The
The |
If you then click on an item, you are taken to that section of the report.
| |
|
|
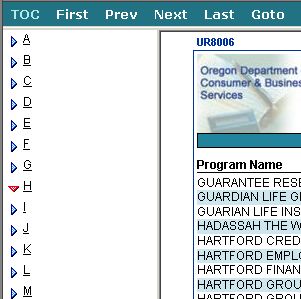
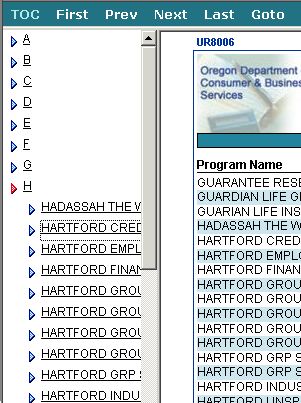 This sample shows the previous contents
item, H, expanded.
This sample shows the previous contents
item, H, expanded. 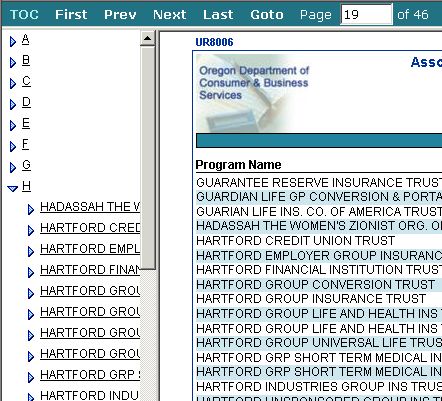 In this example, the user clicked on the
2nd item listed under H, Hartford Credit
Union Trust.
In this example, the user clicked on the
2nd item listed under H, Hartford Credit
Union Trust.